mit6.828 Lab1
This article records my answers to part of the exercises in MIT6.828 Lab1.
Exercise 7
1 | Exercise 7. Use QEMU and GDB to trace into the JOS kernel and stop at the movl %eax, %cr0. Examine memory at 0x00100000 and at 0xf0100000. Now, single step over that instruction using the stepi GDB command. Again, examine memory at 0x00100000 and at 0xf0100000. Make sure you understand what just happened. |
Here is some GDB record concerning the first question.
=> 0x100025:    mov    %eax,%cr0Breakpoint 2, 0x00100025 in ?? ()
(gdb) x/10x 0x100000
0x100000:  0x1badb002  0x00000000  0xe4524ffe  0x7205c766
0x100010:  0x34000004  0x2000b812  0x220f0011  0xc0200fd8
0x100020:  0x0100010d  0xc0220f80
(gdb) x/10x 0xf0100000
0xf0100000 <_start-268435468>:  0x00000000  0x00000000  0x00000000  0x00000000
0xf0100010 <entry+4>:   0x00000000  0x00000000  0x00000000  0x00000000
0xf0100020 <entry+20>:  0x00000000  0x00000000
(gdb) si
=> 0x100028:    mov    $0xf010002f,%eax
0x00100028 in ?? ()
(gdb) x/10x 0x100000
0x100000:  0x1badb002  0x00000000  0xe4524ffe  0x7205c766
0x100010:  0x34000004  0x2000b812  0x220f0011  0xc0200fd8
0x100020:  0x0100010d  0xc0220f80
(gdb) x/10x 0xf0100000
0xf0100000 <_start-268435468>:  0x1badb002  0x00000000  0xe4524ffe  0x7205c766
0xf0100010 <entry+4>:   0x34000004  0x2000b812  0x220f0011  0xc0200fd8
0xf0100020 <entry+20>:  0x0100010d  0xc0220f80
It's obvious that after instruction movl %eax, %cr0, address 0xf0100000 is mapped to 0x00100000. Thus we can make a reasonable assumption that the instruction enables paging mechanism. Looking deep in function of reg CR0
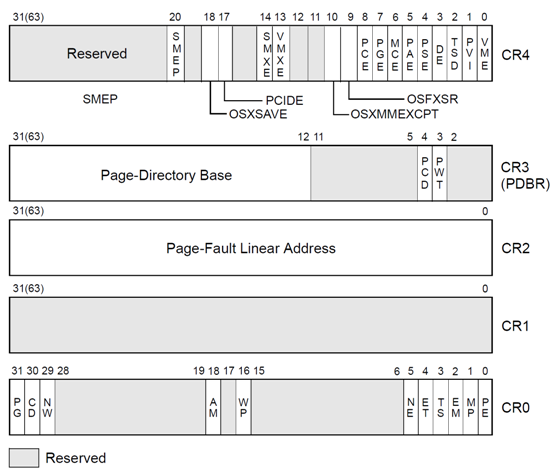
and comparing it with the value of CR0 10000000000000010000000000000001, we find OS now enables paging and write protect. Following is a brief introduction about Paging bit.
Enables paging when set; disables paging when clear. When paging is disabled, all linear addresses are treated as physical addresses. The PG flag has no effect if the PE flag (bit 0 of register CR0) is not also set; setting the PG flag when the PE flag is clear causes a general-protection exception (#GP).
Comment out the instruction, recompile the kernel and trace into it, we find it exits here:
=> 0x100028:   jmp    *%eax
0x00100028 in ?? ()
(gdb)
=> 0xf010002a <relocated>:   add    %al,(%eax)
relocated () at kern/entry.S:74
74      movl    $0x0,%ebp           # nuke frame pointer
(gdb) si
Remote connection closed
with qemu error information:
1 | qemu: fatal: Trying to execute code outside RAM or ROM at 0xf010002a |
Exercise 8
1 | Exercise 8. We have omitted a small fragment of code - the code necessary to print octal numbers using patterns of the form "%o". Find and fill in this code fragment. |
1 | // in lab1/lib/printfmt.c |
1 | // What is the purpose of this? |
1 | When the CGA display is full, lift all rows to make an available line at the end of the CGA. |
Exercise 9
1 | Exercise 9. Determine where the kernel initializes its stack, and exactly where in memory its stack is located. How does the kernel reserve space for its stack? And at which "end" of this reserved area is the stack pointer initialized to point to? |
(gdb) x/20i 0xf010002f
=> 0xf010002f <relocated>:   mov    $0x0,%ebp
   0xf0100034 <relocated+5>:    mov    $0xf0110000,%esp
   0xf0100039 <relocated+10>:   call   0xf01000aa <i386_init>
The kernel initializes its stack at 0xf0100034, and the stack is located at 0xf0110000.
1 | relocated: |
In lab1/kern/entry.S, there is a more clear way describing the initialization of the kernel stack and the size of it. KSTKSIZE(4*PAGESIZE defined in lab1/lib/memlayout.h and PAGESIZE=4096 defined in lab1/lib/mmu.h) space has been reserved for the stack. The stack pointer, of course, points the top of the stack, as shown in bootstack section.
Exercise 10
1 | Exercise 10. To become familiar with the C calling conventions on the x86, find the address of the test_backtrace function in obj/kern/kernel.asm, set a breakpoint there, and examine what happens each time it gets called after the kernel starts. How many 32-bit words does each recursive nesting level of test_backtrace push on the stack, and what are those words? |
Here's corresponding output during calling the test_backtrace function.
1 | entering test_backtrace 5 |
Each time it gets called after the kernel starts, a corresponding stack frame is created. Here is a record when test_backtrace is called for the first time.
=> 0xf0100048 <test_backtrace+8>:   push   %ebx
0xf0100048 in test_backtrace (x=-267321352) at kern/init.c:13
13  {
Stack level 0, frame at 0xf010ffd8:
 eip = 0xf0100048 in test_backtrace (kern/init.c:13); saved eip = 0x10094
 called by frame at 0xf010ffe0
 source language c.
 Arglist at 0xf010ffd0, args: x=-267321352
 Locals at 0xf010ffd0, Previous frame's sp is 0xf010ffd8
 Saved registers:
  eip at 0xf010ffd4
eax            0x0                 0
ecx            0x3d4               980
edx            0x3d5               981
ebx            0xf0111308          -267316472
esp            0xf010ffd4          0xf010ffd4
ebp            0xf010ffd8          0xf010ffd8
esi            0x10094             65684
edi            0x0                 0
eip            0xf0100048          0xf0100048 <test_backtrace+8>
eflags         0x46                [ PF ZF ]
cs             0x8                 8
ss             0x10                16
ds             0x10                16
es             0x10                16
fs             0x10                16
gs             0x10                16
The address stack pointer(%esp) pointing changes during the function call, and here is the structure of the frame.
1 | ^ +-------------+ |
In lab1/obj/kern/kern.asm we observe that add $0x10,%esp appears after each function call inside test_backtrace, which indicates that the space of the (local vars. + other data) = 0x10 bytes. Actually, in test_backtrace there is no local vars., and other data = arg. list+return addr. of a calling function (cprintf for example).
Back to the question, test_backtrace pushes many 32-bit words each recursive nesting level of on the stack. I say many because counting is meaningless for me after understanding the structure of the stack frame.
Exercise 11
1 | Exercise 11. Implement the backtrace function as specified above. Use the same format as in the example, since otherwise the grading script will be confused. When you think you have it working right, run make grade to see if its output conforms to what our grading script expects, and fix it if it doesn't. After you have handed in your Lab 1 code, you are welcome to change the output format of the backtrace function any way you like. |
1 | int |
Exercise 12
Exercise 12. Modify your stack backtrace function to display, for each eip, the function name, source file name, and line number corresponding to that eip.
In debuginfo_eip, where do __STAB_* come from? This question has a long answer; to help you to discover the answer, here are some things you might want to do:
- look in the file
kern/kernel.ldfor__STAB_* - run objdump -h obj/kern/kernel
- run objdump -G obj/kern/kernel
- run gcc -pipe -nostdinc -O2 -fno-builtin -I. -MD -Wall -Wno-format -DJOS_KERNEL -gstabs -c -S kern/init.c, and look at init.s.
- see if the bootloader loads the symbol table in memory as part of loading the kernel binary
Complete the implementation of debuginfo_eip by inserting the call to stab_binsearch to find the line number for an address.
Add a backtrace command to the kernel monitor, and extend your implementation of mon_backtrace to call debuginfo_eip and print a line for each stack frame of the form:
1 | K> backtrace |
Each line gives the file name and line within that file of the stack frame's eip, followed by the name of the function and the offset of the eip from the first instruction of the function (e.g., monitor+106 means the return eip is 106 bytes past the beginning of monitor).
Be sure to print the file and function names on a separate line, to avoid confusing the grading script.
Tip: printf format strings provide an easy, albeit obscure, way to print non-null-terminated strings like those in STABS tables. printf("%.*s", length, string) prints at most length characters of string. Take a look at the printf man page to find out why this works.
You may find that some functions are missing from the backtrace. For example, you will probably see a call to monitor() but not to runcmd(). This is because the compiler in-lines some function calls. Other optimizations may cause you to see unexpected line numbers. If you get rid of the -O2 from GNUMakefile, the backtraces may make more sense (but your kernel will run more slowly).
There are three tasks in summary:
- Complete the implementation of
debuginfo_eip - Modify
test_backtraceto meet requirements - Add command backtrace to call
test_backtrace
As for the first one, only a small piece of code with simple logic needs to be added, which is shown as follow.
1 | // Search within [lline, rline] for the line number stab. |
The completed debuginfo_eip is now used to modify function test_traceback.
1 | int |
Note that a tip mentioned above should be used to control the length of eip_fn_name.
To complete the third task, a struct about backtrace should be added into command list.
1 | static struct Command commands[] = { |